Shared mobility and its impact on emissions
by Siddartha Rayaprolu
Traditionally within the United States, transportation choices have featured personal vehicles and to a lesser extent alternative modes, like transit, bicycles, and taxis. Bureau of Transportation Studies (BTS) indicated that more than 75% of the trips are “Drive alone” and the remaining 25% trips include all the alternative transport modes. A study conducted by researchers in California suggests that the United States transportation activity by itself accounts for nearly 70% of all petroleum consumption and about 30% of all the Greenhouse gas emissions. It roughly consumes 96% of all energy in the form of gasoline or diesel (Martin, E. W., & Shaheen, S. A. (2011)).
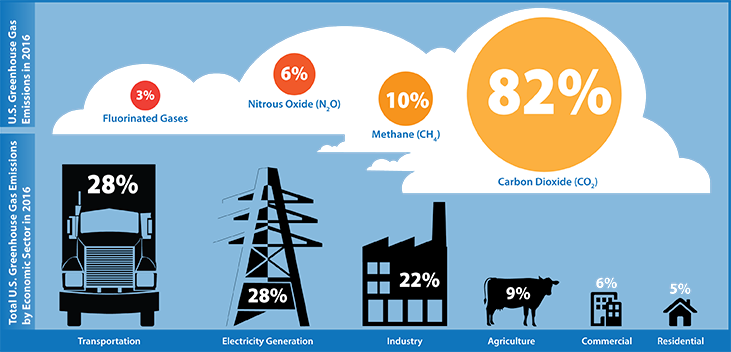
Revisiting the impacts of vehicular pollution, the EPA states that the majority of greenhouse gas emissions from transportation are due to the combustion of fossil fuels resulting in Carbon Dioxide (CO2) emissions. Majority of the Carbon Monoxide (CO) is produced when the vehicle is moving slow or when it is stuck in a poor traffic condition. Traffic congestions which are a product of the higher volume of vehicular flow lead to higher production of greenhouse gases.
Thanks to the emerging technologies as travelers are currently able to hail a private driver and vehicle (e.g., Lyft and Uber); rent an automotive or a bicycle for a brief trip (e.g., Zipcar and Bay area Bike Share); ride a shuttle on-demand (e.g., Bridj, Chariot, Via); and have groceries or takeaway delivered in someone’s personal vehicle (e.g., Postmates and Sidecar Deliveries)—all with the support of the web and smartphones. These innovative transportation services are increasing at a time when agencies, like State Departments of Transportation (DOTs) and regional Metropolitan Planning Organizations (MPOs), are more and more targeted on rising system potency and alleviating the negative environmental impacts of transportation.
Researchers around the world have studied and quantified the impacts of these shared mobility platforms and have suggested that there is a considerable impact on the environment and the traffic behavior with the improving usage statistics of these modes.
Although the percentage impact of Bike-share has not been widely quantified, early documented impacts include increased mobility, reduced GHG emissions, reduced automobile use, economic development, and health advantages. Past research by Shaheen, S. A. et al (2014) indicates that 50% of the respondents in their survey reported a reduction in personal vehicle usage. 5.5% of the respondents have reported having sold or postponed a vehicle purchase, 58% increased cycling.
Car-pooling / Ride-sharing reduces about 109,000 to 155,000 tons of GHG/year by observed impact (evaluation based on emissions that physically occur) and between 158,000 to 224,000 tons of GHG/year for full impact (based on emissions that would have happened anyway but were avoided or delayed due to carsharing). A study in SF estimated a total reduction of 450,000 to 900,000 gallons of gasoline per year is observed in the San Francisco Bay Area, which accounts up to 50-100 gallons per participant. Minett, P., & Pearce, J. (2011) estimated a total reduction of 450,000 to 900,000 gallons of gasoline per year is observed in San Francisco Bay Area, which accounts up to 50-100 gallons per participant.
All these aside, Ride-hailing is observed to have a negative impact on reducing vehicle miles traveled (VMT) by cannibalizing the public transit ridership by 33% and by 8% due to induced travel effect on the carless community. A study conducted by Henao, A. (2017) in Denver, indicated that the ride-hailing takes more vehicular trips to move fewer people (approximately, 100 vehicle miles to transport a passenger 60.8 miles (or nearly 40% out of service miles).
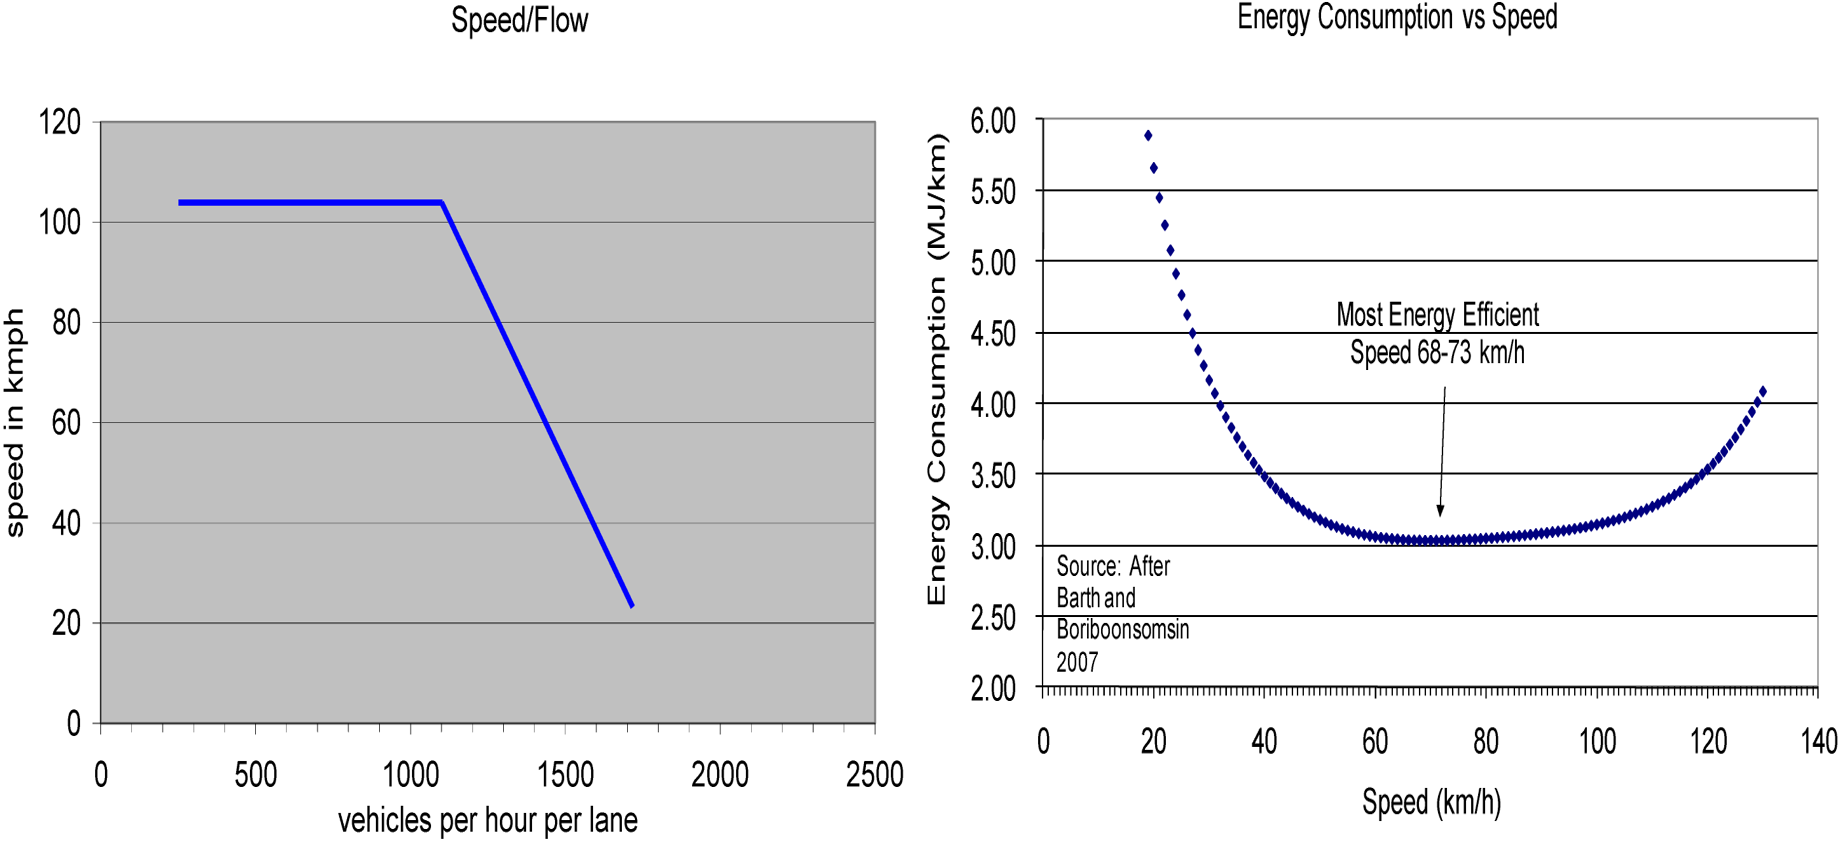
The more the number of vehicles on the road, the higher is the volume, the lower is the flow and hence the higher will be the emissions due to CO. Policy briefings are always important in order to facilitate the free movement of the HOVs. Also, licensure laws have to be adaptive in design, based on the city and its capacity to accommodate these shared vehicular fleet, which will stay on the roads most of the time. The below figure by Minett, P., & Pearce, J. describe the relationship between the energy consumption, vehicular flow rate, and speed.
Shared mobility collectively has a great potential to reduce the greenhouse gas emissions, however, there are certain limitations in terms of the policies and the accommodations that have to be addressed succinctly in order to facilitate a smooth transition between the modes. Policy advocacy plays an important role in controlling the food chain for these shared modes to fit into the bigger picture of the transport business model, otherwise might lead to cannibalization of existing low emission alternatives by smaller capacity cars that make multiple trips to facilitate the utilitarian needs of the users.
References:
Martin, E. W., & Shaheen, S. A. (2011). Greenhouse gas emission impacts of carsharing in North America. IEEE Transactions on intelligent transportation systems, 12(4), 1074-1086.
Shaheen, S. A., Martin, E. W., Cohen, A. P., Chan, N. D., & Pogodzinski, M. (2014). Public Bikesharing in North America During a Period of Rapid Expansion: Understanding Business Models, Industry Trends & User Impacts, MTI Report 12-29.
Minett, P., & Pearce, J. (2011). Estimating the energy consumption impact of casual carpooling. Energies, 4(1), 126-139.
Kaviti, S., M.M. Venigalla, S. Zhu, K. Lucas, and S. Brodie. (2018). Impact of Pricing and Transit Disruptions on Bikeshare Ridership and Revenue. Transportation. Springer Publications. (http://doi.org/10.1007/s11116-018-9904-5).